Most people hear "LiDAR" and think of one thing: creating tracks for sim racing. And that's a significant application. But it's a fraction of what the data actually enables.
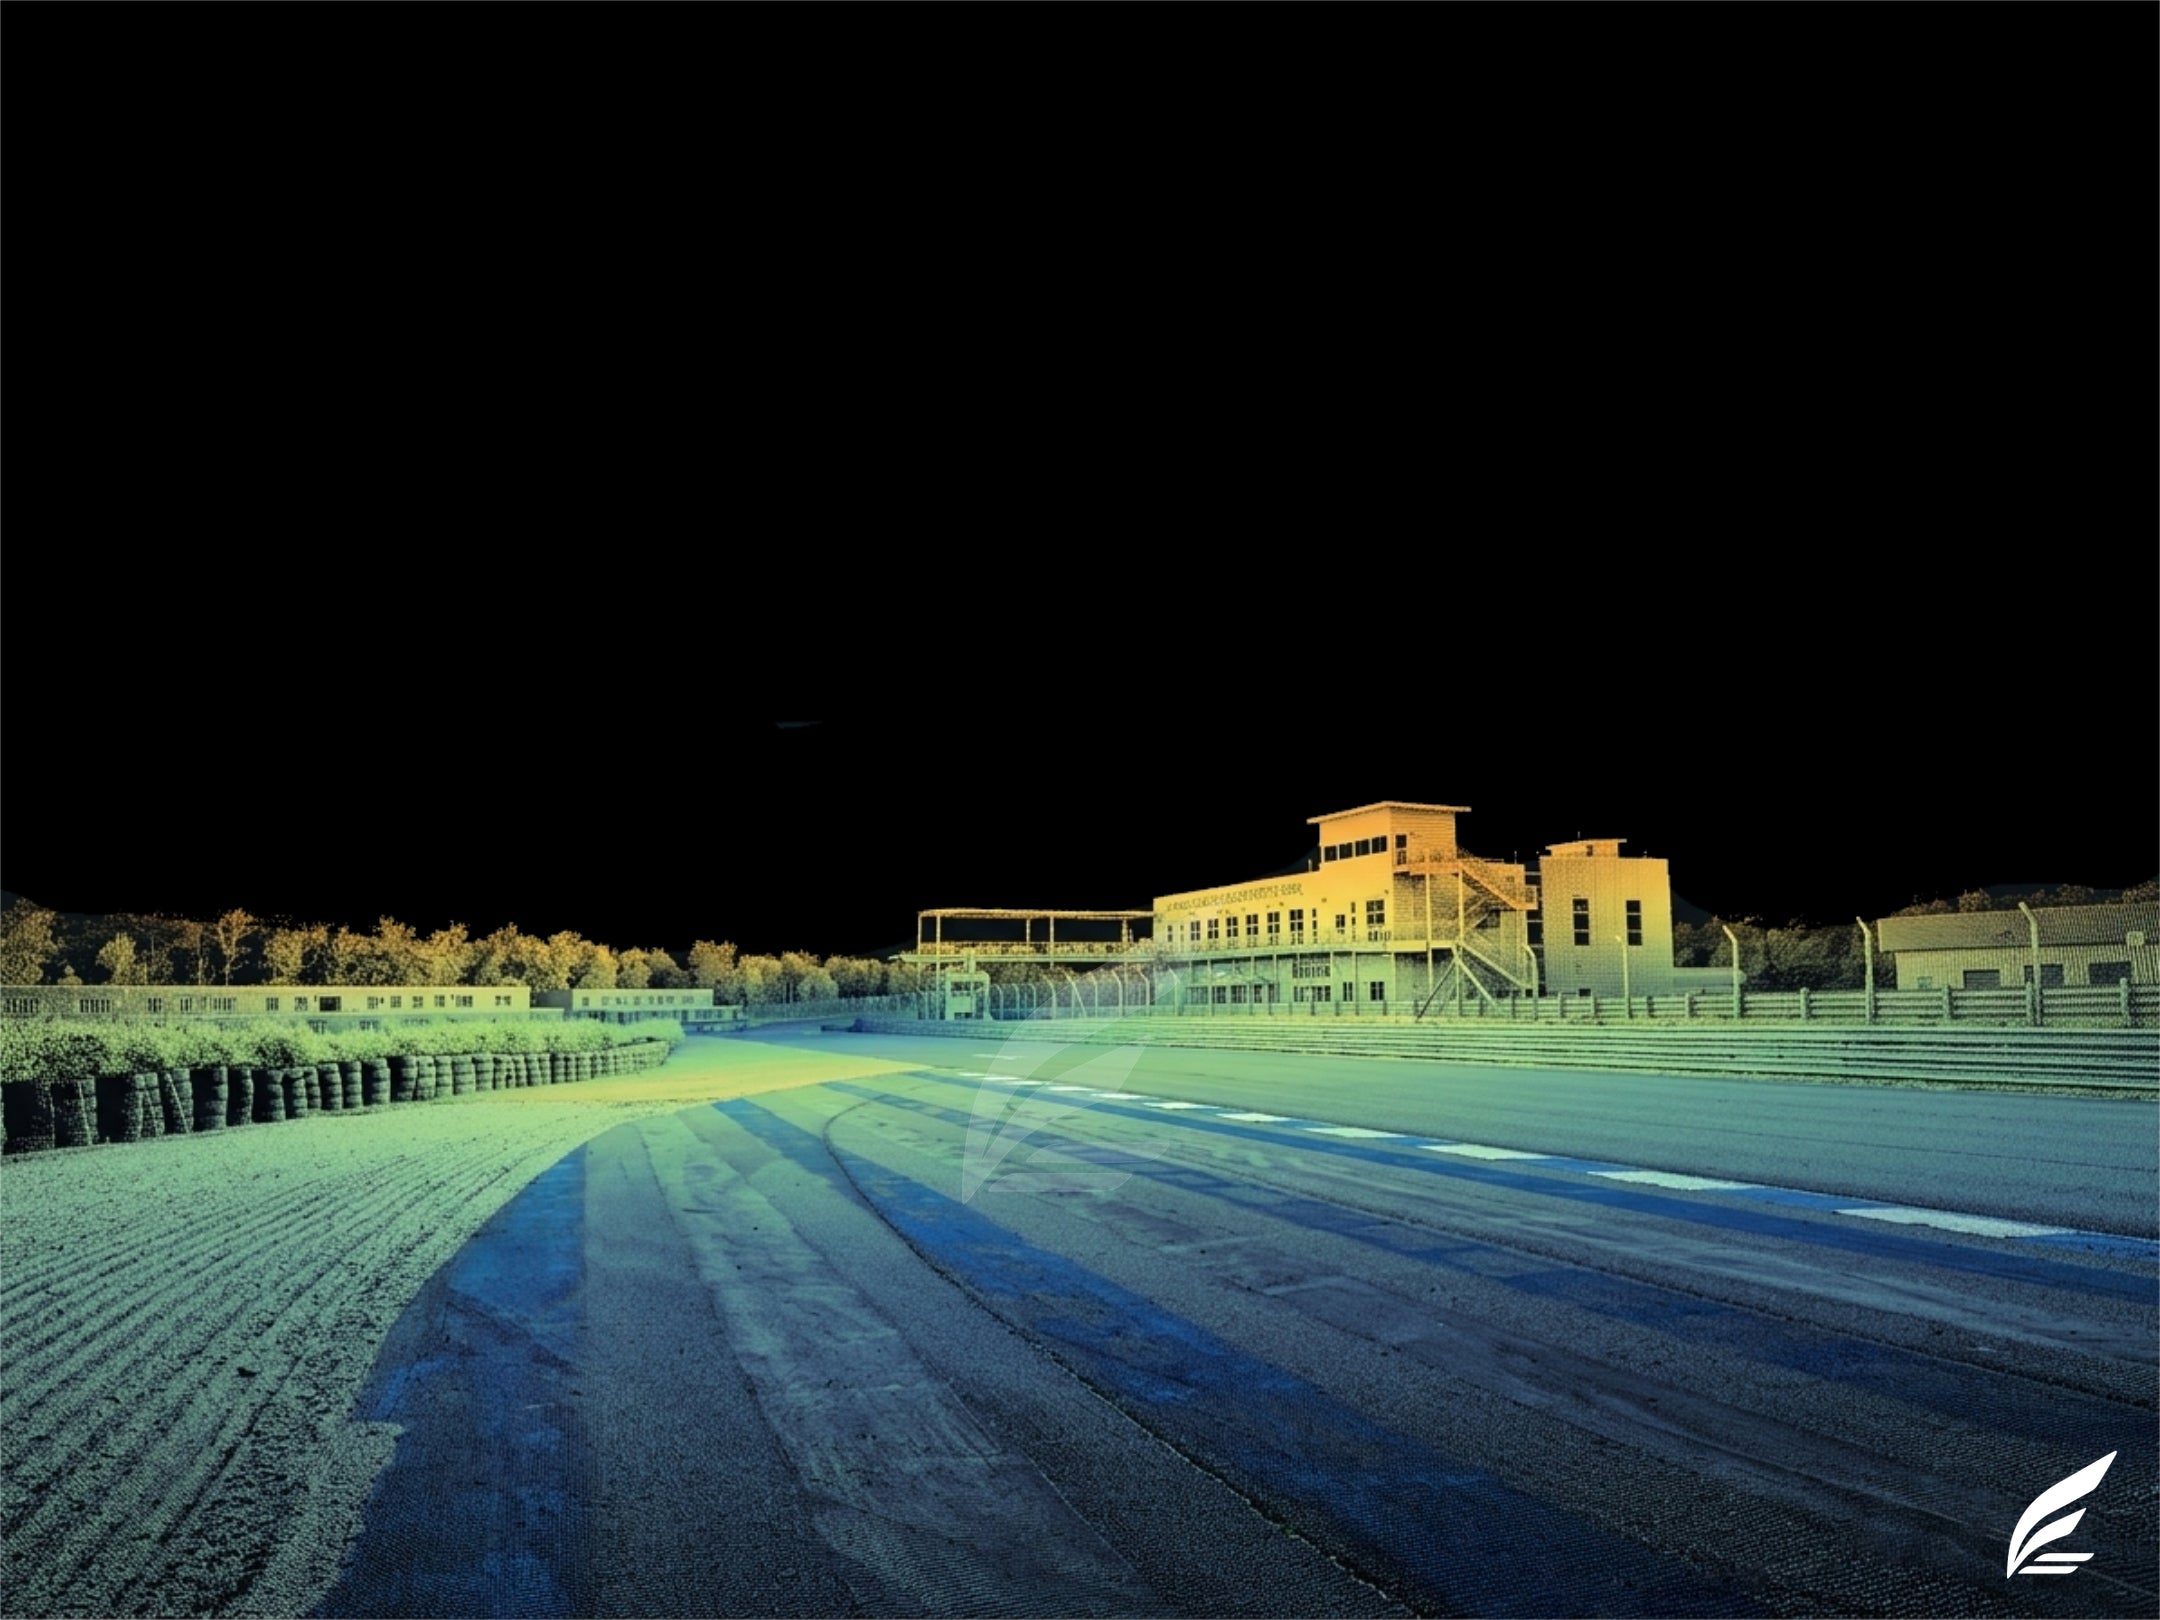
A LiDAR scan of a racetrack produces a three dimensional point cloud containing millions of precision measurements. That dataset is a resource that can be applied across multiple disciplines simultaneously. Driver coaching becomes more precise. Track design decisions become data driven. Safety analysis moves from subjective observation to engineering rigor.
The same scan. Three completely different applications. Each one transformative in its own right.
Driver Coaching: Teaching With Geometry
Great coaching has always relied on understanding why a driver is fast or slow, not just where. LiDAR data gives coaches a tool that was never available before: an exact geometric model of the surface the driver is operating on.
Braking Zone Analysis
When a coach reviews a driver's braking data, they see where the driver began braking, how quickly they decelerated, and where they released. What they haven't traditionally been able to see with precision is the surface geometry underneath those braking events.
With LiDAR data overlaid on telemetry, a coach can now see that the braking zone into Turn 4 has a 1.5% downhill gradient that begins 20 meters before the brake marker. That gradient extends the car's stopping distance. A driver who brakes at the same reference point as Turn 2, which is flat, will overcook the entry because the geometry is working against them.
This isn't a guess. It's measured. And it changes the coaching conversation from "you're braking too late" to "the surface drops here, which means your effective braking distance is longer. Move your reference 10 meters earlier and you'll carry more control through the entry."
Racing Line Optimization
The ideal racing line through a corner isn't just about geometry on a flat plane. It's about three dimensional geometry: the camber, the elevation change, and the surface transitions that exist along different paths through the corner.
LiDAR data reveals that the "obvious" line through a corner might cross a negative camber zone that reduces grip. An alternative line, slightly wider at the apex, might stay on positive camber that supports the car better. A coach with this data can explain line choices in terms of physics rather than intuition, which accelerates the driver's understanding.
Surface Awareness
Every racetrack has surface features that affect car behavior: bumps, patches, seams between old and new pavement, areas where the surface has settled over time. Drivers learn these features through experience, but the learning process is slow because the features are often subtle and their effects are indirect.
A LiDAR derived surface map shows these features explicitly. A coach can walk a driver through the data and say: "There's a bump at the apex of Turn 7 that unloads the front right tire. When you carry too much speed here, the car pushes because the tire loses contact patch momentarily. Slow your entry by two mph and the bump won't upset the car."
This kind of specificity transforms coaching from art into applied science.
Track Design: Building Better Circuits
LiDAR data has become an essential tool for track designers and architects, both for evaluating existing circuits and for planning new ones.
Evaluating Existing Layouts
Every racetrack evolves over time. Asphalt settles. Curbs wear. Drainage patterns shift. Vegetation grows. These changes can be gradual enough that they go unnoticed through visual inspection, but they accumulate into measurable deviations from the original design intent.
A LiDAR scan provides a precise snapshot of the facility as it exists today. Track designers can compare this data against the original engineering plans (if they exist) to identify where reality has diverged from design. Has the camber in Turn 3 changed? Has the runoff distance in the braking zone for Turn 9 been reduced by earth movement? Is the crown of the straight still adequate for drainage?
These questions can only be answered with measurement, and LiDAR provides that measurement at a level of detail no other method can match.
Designing Modifications
When a track operator wants to modify their circuit, whether it's adding a chicane, reconfiguring a corner, or extending a straight, the starting point needs to be an accurate model of the existing surface. Without it, the design is based on assumptions about what's currently there.
LiDAR data provides the as built condition. Designers can model proposed changes directly onto the real geometry, evaluate sight lines from the driver's perspective, calculate drainage impacts, and verify that the modification integrates smoothly with the existing surface.
This eliminates the costly surprises that occur when construction begins on a surface that doesn't match the drawings.
Planning New Facilities
For new circuit development, LiDAR scanning of the raw terrain provides the foundation for the entire design process. The natural topography of the site, its elevation changes, drainage characteristics, soil composition indicators, and spatial constraints can all be captured before a single line is drawn.
Designers working from LiDAR data can create circuits that work with the natural terrain rather than fighting it. A designer who can see that the site has a natural 15 meter elevation change across 400 meters can incorporate that change into a dramatic downhill braking zone or a high speed crest, features that create exciting, character defining corners that feel organic to the landscape.
Safety Analysis: Measuring What Matters
This is the application of LiDAR data that has the most direct impact on human safety, and it's the one that deserves the most attention.
Runoff Distance Verification
Every corner on a racetrack has a required runoff distance based on the sanctioning body's safety standards. These requirements are calculated based on approach speed, surface material, and the presence of energy absorbing barriers.
Measuring runoff distances traditionally involves walking the facility with a measuring wheel or GPS unit. These methods are adequate but limited in precision and time consuming to execute comprehensively.
A LiDAR scan measures every runoff area simultaneously, from the track edge to the barrier, with centimeter level accuracy. The data can be analyzed systematically to verify compliance across the entire facility, not just the corners where someone happened to point the measuring tool.
Barrier and Wall Positioning
The exact position, height, and angle of every barrier and wall on the circuit can be extracted from LiDAR data. This allows safety officials to verify that barriers are in the correct positions, that they overlap correctly (for SAFER barriers and Armco), and that there are no gaps or misalignments that could create hazards.
Post incident analysis also benefits. If a car impacts a barrier, the pre incident LiDAR data provides the exact geometry of the barrier at the impact point, which can be compared against the manufacturer's installation specifications.
Sight Line Analysis
Driver sight lines, what a driver can see from a specific position on the track at a specific speed, are critical for safety. A crest that obscures the view of a slow corner creates a situation where a driver may not see a stopped or slow moving car until it's too late.
LiDAR data enables three dimensional sight line analysis from any point on the circuit. Engineers can model what a driver sees from the cockpit at any position, accounting for elevation changes, banking, barrier heights, and environmental features. This analysis can identify sight line deficiencies that are not obvious during a physical track walk.
Surface Safety Assessment
Ruts, depressions, raised seams, and surface irregularities in high speed zones can cause loss of control. LiDAR data identifies these features with precision, allowing track operators to prioritize repairs based on their location and severity.
A 15mm rut on a slow speed access road is cosmetic. The same rut at the apex of a 120 mph corner is a safety hazard. LiDAR data provides the measurement; the context determines the priority.
Regulatory Compliance Documentation
Sanctioning bodies (FIA, FIM, SCCA, NASA, IMSA, and others) have specific facility requirements for each level of competition they license. Demonstrating compliance requires documentation, and LiDAR data provides the most comprehensive and defensible documentation available.
A facility submitting a LiDAR based safety assessment is presenting engineering data, not estimates. This strengthens the application for event licensing and provides a reference document for ongoing compliance monitoring.
The Interconnection
What makes LiDAR data truly powerful is that these three applications, coaching, design, and safety, are not isolated. They inform each other.
A safety analysis that identifies a sight line issue at a specific corner informs a design modification to improve that corner's geometry. The redesigned corner changes the racing line, which informs the coaching approach for drivers learning the updated layout. The coaching data, in turn, provides feedback on how the modification performs in practice, which feeds back into future design decisions.
The data creates a loop: scan, analyze, improve, validate. Each cycle makes the facility safer, more enjoyable, and more productive for the drivers who use it.
The Accessibility Shift
Five years ago, this level of analysis was available only to the largest, best funded circuits in the world. The scanning equipment was expensive. The processing required specialized software and expertise. The entire workflow was a significant investment.
That equation is changing. Drone based LiDAR systems have reduced scanning costs dramatically. Processing software has become more accessible. The expertise to interpret the data for motorsport applications is growing as more engineers and consultants enter the space.
For the first time, regional circuits, karting facilities, and private motorsports parks can access the same data quality that F1 venues have relied on for years. The technology that was once exclusive to the top tier is now available to anyone who recognizes its value.
The question isn't whether LiDAR data can improve your facility, your coaching, or your safety program. It's whether you're ready to start using it.
RRG Racing's sister company Lunis delivers LiDAR scanning and data analysis services for motorsports facilities, coaching programs, and track development projects. We understand the data because we use it ourselves, every day, at our home base at Atlanta Motorsports Park in Dawsonville, Georgia. Visit rrgracing.com to learn more about what scanning can do for your operation.
Share:
The Growing Role of Simulators in Motorsports Parks and Entertainment Venues
Assetto Corsa vs iRacing: Choosing the Right Platform for Your Goals